Well, I’m back! My first blog post in over a year came about as I have been inspired by working closely with our fantastic APJ Principal Data Scientist, Dr Tatiana Bokareva, over the last 18 months to help our customers understand how they can use data to achieve better business outcomes. Between us, we cover both the analyst and data scientist personas and discuss examples from the descriptive, predictive and prescriptive family of analytics (covered in a previous blog post). In this post, we will explore the power of path analysis.
For both analysts and data Scientists, identifying paths and patterns in data is a valuable way to gain insight into the occurrences leading to or from any event of interest. Descriptive analytics enables us to look to historical events and, for example, determine what the common pattern of events were leading to a part failure (or customer churn or a customer call), Organisations are trying to do this today, often spending significant money in bespoke solutions and specialised consulting. With the amount of data being captured today, the data itself can be used to unlock the potential of path analysis down to the most granular level available. You can turn a complex set of events into valuable business insights.
Path analysis is effective in providing insights into the steps taken to both a positive event (e.g., Mortgage Application) as well as negative event (e.g., Account Closure). The goal of analysing positive paths is to determine how to encourage customers to stay on the path and not drop out. Negative paths are the opposite, you want to identify customers on the path so you can stop them and prevent the negative outcome from happening altogether.
With Vantage Path Analysis, a business user can dive incredibly deep into their most important paths by simply specifying a few parameters in drop-down menus and clicking “Show Me.” No coding. No specialized skills. Just deep insights in seconds. We can help you identify – visually – the handful of events across channels that most commonly precede a conversion and where there are cracks in the process.
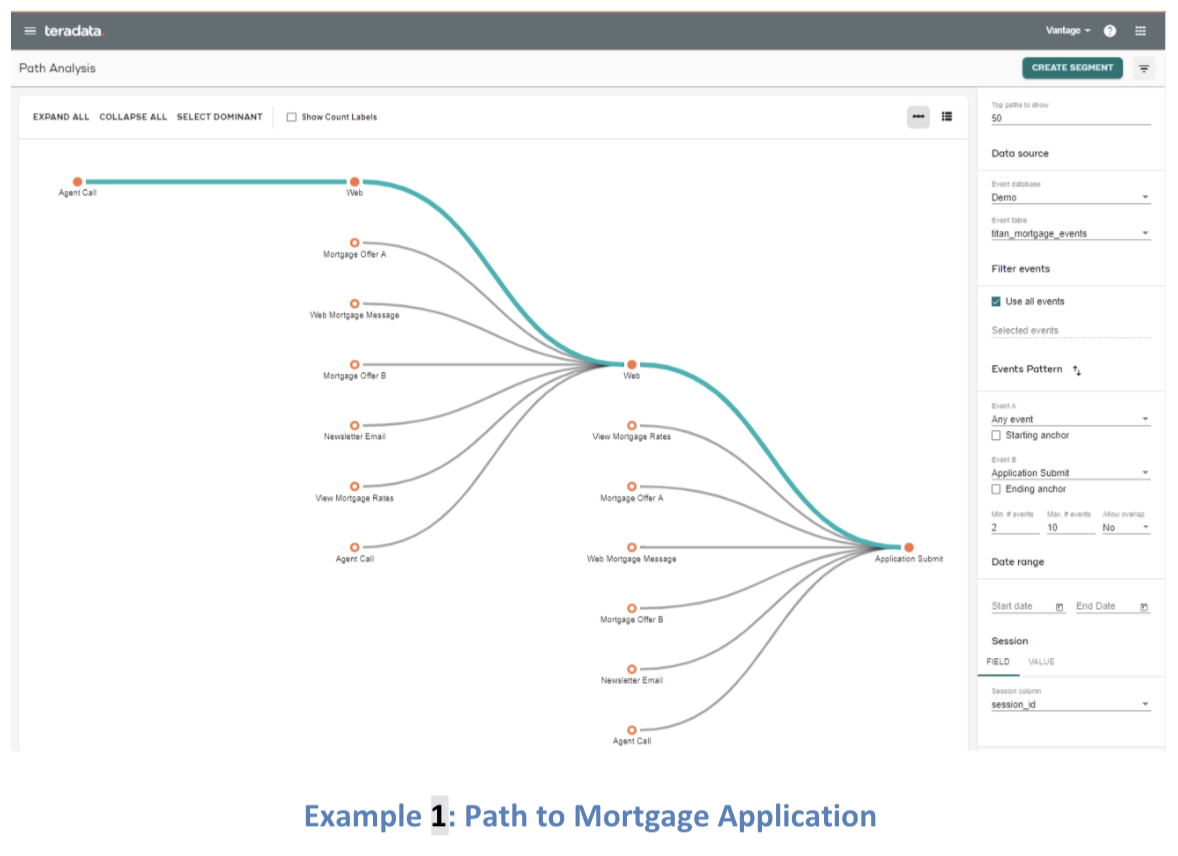
The following visualisation is an example of the path to mortgage application, with the most common path highlighted in teal.

Visualising a Path and identifying a “golden” path can itself be actionable and often uncovers an area of interest for additional analysis. For example, Banco Bradesco uses nPath (the underlying Vantage function for Path Analysis) as an input for a mortgage propensity model. Rather than running a simple propensity model, the team first applies nPath analytics with features such as demographic variables. The nPath analytics output is added as an additional variable to a mortgage propensity model, like a linear regression model, random forest, or XGBoost model.
“The beauty of this case is that we are talking about two different things but, together, they come out with a better result. One part is that we’re now able to use more sophisticated tools in Teradata to do analytics. And two, using Python and R with different techniques by including a new variable, coming from the nPath, inside our new Python models. The combination of these two things is where we really see the positive impact that we can have” said Gian Cantarella, Head of CRM, Banco Bradesco.
All industries can benefit from the power of path analysis. Let’s look at some ways you could apply path-based behavioural segmentation to improve your marketing, with a focus on mobile-related use cases.
- Retail: Who opens my app and goes straight to the discounted offer? Should I change the order in which the app displays various offers and discounts based on whether someone is a discount-first app user or a user who just wants to browse?
-
Financial services: Who walks into my bank branch shortly after engaging with the mobile app? Are there ways I could better serve this behaviour-based segment in the mobile channel to reduce expensive branch visits? Are there offers I could promote to this segment in-branch to make their visit more profitable for me and a better long-term value for them?
-
Telecommunications: What are my most common paths to churn? Should I offer the same discount to segments who had three or more dropped calls this month as segments with family members who cancelled their service last month? Or do these different behaviour-based segments on different paths require unique approaches to save their accounts?
Based on our experience with data science teams, we know paths can be significant predictors of future action or inaction, especially when combined with some other advanced analytics techniques. But for businesspeople hoping to prevent churn, for example, simply knowing which customers are on those common paths to churn is of immense value.


